Various reports are available through the ACE Online program, including course reports, comments reports, individual responses reports, and instructor reports. Access to these reports will depend on permissions allowed by an instructor’s college.
Access the ACE Standard Reports
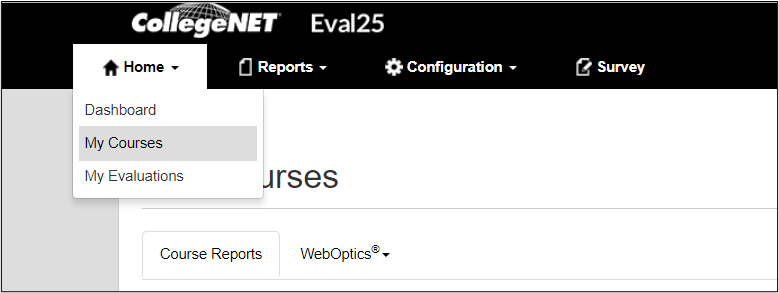
Upon logging into the ACE Online program, you will see the My Courses page.
If you are also a student in the course evaluation system, you will need to select My Courses from the drop down menu.
Read more about how to access your reports.
The reports available can be viewed within the browser or downloaded as .PDF or Excel files.

- To view the reports within the browser click View link beside the report you wish to view.
- To download a specific report as a .pdf click the .pdf icon beneath the report you wish to download.
- To download the Excel version of the Course Report click the Excel icon beneath the report title.
Course Report
The Course Report shows you all the statistical information for all quantitative questions within the evaluation.
- Category statistics are shown at the top of the report.
- Moving down the page, each category is then broken down by question.
- You can change how the data is displayed by selecting a different display option from the menu in the upper right hand corner of each category.
- You can switch between reports by using the drop down menu in the upper right hand corner of the page.
- You can also download .pdf and Excel (if applicable) versions of each report from the upper right hand corner of the page.
Comments Report
The Comments Report page shows comments by students who evaluated a particular course taught by a particular instructor.
Read more about viewing the comments report.
Individual Responses Report
The Individual Responses page shows student evaluation responses for the course(s) you selected. The data is entirely anonymous and customized based on your evaluation questions.
Read more about viewing the individual responses report.
Instructor Report
The Instructor Report displays qualitative comments and average response values for an instructor by term for a specific evaluation form.
Read more about viewing the instructor report.
WebOptics
The WebOptics tab provides two ways to view your evaluation scores and compare them to department averages: Summary and Question.
Read more about the WebOptics views.
WebOptics Reporting - Summary
- From the My Courses page, click the WebOptics tab.
- Select the Summary option.
A bar graph of the average of all evaluation scores for all your courses with a superimposed line graph of the average evaluation score for all courses in your department will be displayed.
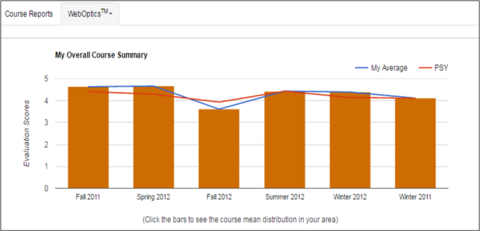
Reading the chart:
- The red line represents the department’s overall mean for a semester.
- The blue line represents the instructor’s overall mean for a semester.
WebOptics Reporting - Question
- From the My Courses page, click the WebOptics tab.
- Select the Question option.
For each closed evaluation term, the Question view displays:
- A list of evaluation questions.
- An average score ranking by question as compared to your department’s average score.
- An average score difference for the selected question, comparing your average score with the average score of your department.
- A “heat map” of your average score for each question compared to your department’s average score.